An Introduction to Time Domain Reflectometers
eCADSTAR and the TDR in Hardware and Simulation
The TDR has been around for a long time. It’s standard equipment for many engineers, including telecommunications and home broadband installers. The TDR analysis in eCADSTAR’s Signal Integrity Advanced creates results similar to a TDR with simulation.
The hardware TDR
One day in Glasgow, a long time ago, my colleague, Dugald, led me to a side lab packed with equipment and a tangle of wiring. Dugald built his own amateur radio kit and used it to chat with other radio amateurs around the world. I was new and in awe of his skills.
“What do you think this does?” he asked me, gesturing towards a big blue box with lots of knobs and a screen.
“Oscilloscope?” I replied.
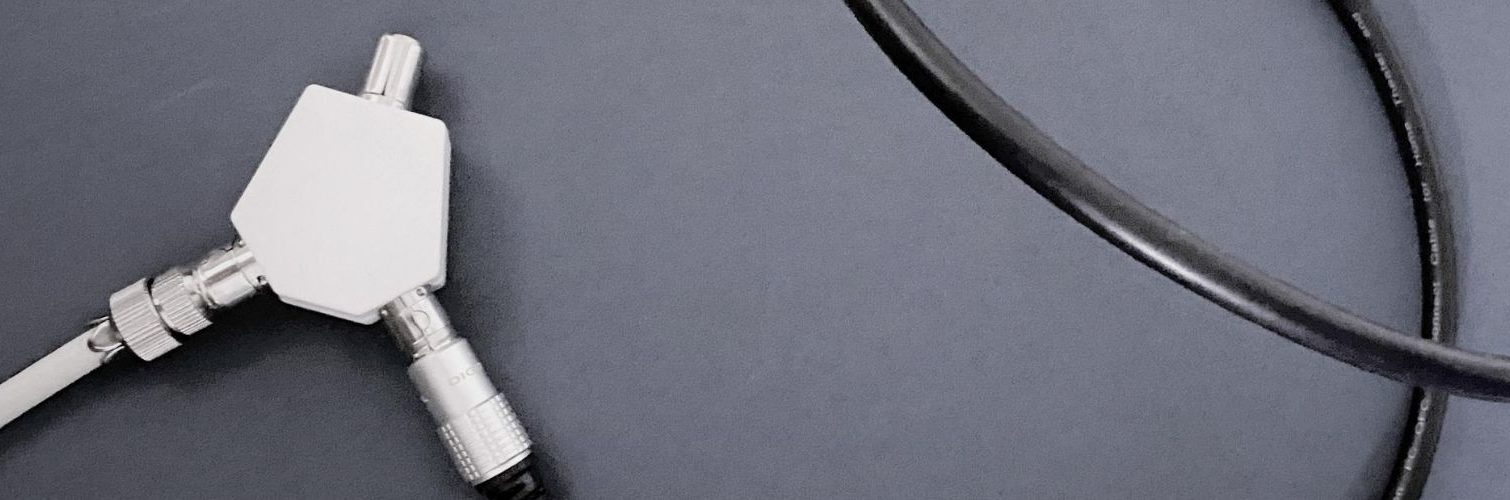
He shook his head and pointed to two lengths of coax, joined by a Y-connector, dangling from the front panel. “What do you think is going on here?”
A bit like the arrangement in Figure 1.

I’d thought the dangling cables had been left there when something had been disconnected, so I said so.
He pointed to the screen and a blip on the trace. “That’s the connector.”
It was then that I learned how discontinuities cause reflections and how, if you knew how fast a wave traveled down a cable, you could tell where they were. You send a pulse down the cable – like a scout. It hits the discontinuity and a bit of it comes back to tell you where it is. You can see what happens in Figure 2. Provided you know how fast the pulse travels – and that’s predictable with good coax – the time it takes for the signal to reach the discontinuity and reflect back to the TDR gives its position.

Last month, a phone guy came to our place to fit a new broadband hub. Ours is still copper wire as far as the box where it switches to fiber. When he disconnected the old hub, he tested the line with a handheld TDR. It’s lucky he did because it showed a small glitch that must have slowed down the old connection for years. Someone had probably dented the cable with a garden spade – maybe that was me. The TDR nailed the size of the discontinuity and its position.
TDR analysis in eCADSTAR
Discontinuities on PCBs can be subtle – including breaks in reference planes and errors in track-to-track spacing. But many things alter waveform shapes. How can you distinguish discontinuity effects from others? How can you locate them exactly and see how serious they are?
TDR analysis focuses specifically on interconnect – locating unexpected discontinuities and seeing if they are big enough to matter. The settings mirror those you would make on a hardware TDR.
You can either use the same models as standard simulation or set up your own pulse or step signal and test conditions.
Example
The best way to see what makes TDR simulation worth having is to use it like the hardware Dugald showed me in the lab. The TDR becomes our signal generator, source impedance, and load impedance. Now we’re looking at the quality of the interconnect and at that alone.
The signal is a differential DDR4 byte lane strobe.
A lot can happen on the road from the controller to SDRAM and TDR simulation makes checking much easier.

Let’s set up a TDR analysis (Figure 5). I know this kind of memory has fast rise times. In any case, fast rise times on a stimulus will find more subtle glitches than slow ones. I want to choose a rise time that my hardware TDR can manage if I need to compare results. I’ve chosen a simple step stimulus with 50ps rise time.
I’ve chosen to disregard simulation models except for package parasitics and connect both ends at the system impedance. In case you’re wondering where I got those single-ended, differential mode and common mode impedances from, they match the expected values in the routing. I created a scenario in Electrical Editor and solved the expected track configuration (Figure 4). The results don’t show a common-mode value directly, but you can get it by dividing the even-mode impedance by two. I played a little rough with the precision, but you can experiment with impedance values, especially when it comes to modality. The difference between the odd-mode and single-ended values depends a lot on differential coupling and the distance to the nearest reference plane.


Results are presented the same way as in standard simulation, with the same richness of options, but I just want to talk about the most obvious ones. The upper plot is voltage and the lower plot is differential impedance. There’s quite a glitch starting at 2ns. In Figure 5, you can see I set Feed-In/Out Delay to 1ns. The round-trip time for that is 2ns, which is where the glitch starts, so something is happening near the controller end of the routing.

Zooming in, you can see I made a mistake in the fan-out from the controller, adding an extra fan-out via on one side of the pair (Figure 7). If I had not turned off automatic ring removal while routing, it wouldn’t have happened.

When I take out the extra via and stub, there’s still a discontinuity on the transition from fan-out to pair routing, but a much smaller one (Figure 8).

A final word on TDR analysis
I like TDR analysis because the setup is self-contained. You can do it without reference to other models and setup, and it’s easy to relate to hardware. You can check high-speed interconnect by itself, taking out other factors that can make it harder to link cause and effect. And if you use hardware TDRs too, their results are easy to relate to eCADSTAR’s TDR analysis results.

-
Jane Berrie•Signal Integrity Expertin, Zuken Tech Center, BristolJane Berrie ist seit den 1980er Jahren im Bereich EDA für PCB-Signalintegrität tätig. Ihre Artikel sind in vielen Publikationen weltweit erschienen - zu viele Male, um sie zu erwähnen. Jane Berrie war auch in der Vergangenheit Vorsitzende für 3D-IC-Design bei der jährlichen Design Automation Conference. Jane ist auch eine Innovatorin mit einer einzigartigen Perspektive, die ständig an neuen Lösungen in der sich schnell entwickelnden Welt des elektronischen Designs arbeitet. In ihrer Freizeit hat Jane thematische Wohltätigkeitsveranstaltungen organisiert - darunter zwei zu Gunsten von Rettungsbooten und dem Überleben des roten Eichhörnchens. Jane ist außerdem eine regelmäßige Disco-Besucherin.
Eine neues Internet-Connected PCB-Design-Plattform. Erhalten Sie eine 30-tägige eCADSTAR-Testlizenz mit vollem Funktionsumfang.
TESTVERSION ANFORDERNBereit für etwas Neues? Wir haben noch mehr für sie zu lesen, hier geht’s lang.

- Blog

- Blog

- Blog
Discover how Quadra Solutions won the prestigious award and what it takes it win!
- Blog
Read more!